MAMEM makes publicly available it’s first experimental dataset. More specifically, EEG signals with 256 channels captured from 11 subjects executing a SSVEP-based experimental protocol. Five different frequencies (6.66, 7.50, 8.57, 10.00 and 12.00 Hz) presented in isolation have been used for the visual stimulation, and the EGI 300 Geodesic EEG System (GES 300), using a 256-channel HydroCel Geodesic Sensor Net (HCGSN) and a sampling rate of 250 Hz has been used for capturing the signals.
Eleven volunteers participated in this study. They all were present employees of Centre for Research and Technology Hellas (CERTH). Specifically, 8 of them were male and 3 female. Their ages ranged from 25 to 39 years old. All of them were able-bodied subjects without any known neuro-muscular or mental disorders. Furthermore, to all but one subjects the adult medium Geodesic Sensor Net (GSN) was applied.
The visual stimuli was projected on a 22’’ LCD monitor, with a refresh rate of 60 Hz and 1680×1080 pixel resolution. The visual stimulation of the experiment was rendered with the graphic card (Nvidia GeForce GTX 860M) fast enough to render more frames than the screen can display was used and vertical synchronization. Also, the option “vertical synchronization” of the graphic card was enabled in order to ensure that only whole frames are seen on screen.
High Dimensional – EEG data were recorded with the EGI 300 Geodesic EEG System (GES 300), using a 256-channel HydroCel Geodesic Sensor Net (HCGSN) and a sampling rate of 250 Hz. Two different HCGSN sizes were used the adult small (54 – 56 cm) and the adult medium (56 – 58 cm) with respect to the subject’s head circumference. The contact impedance at each sensor was ensured to be at most 80 KΩ before the initialization of every new session.
The synchronization of the stimulus with the recorded EEG signal was performed with the aid of the Stim Tracker model ST – 100 (developed by Cedrus), and a light sensor attached to the monitor that added markers to the captured EEG signal. More specifically, the light sensor was able to detect with high precision the onset of the visual stimuli and place appropriate markers on the EEG signal for as long as the visual stimuli flickered, providing evidence of the lasting period and the frequency of the stimulation. Subsequently, in the offline data processing, these markers were used to separate the raw signal into the part generated during the visual stimuli and the part generated during the resting period.
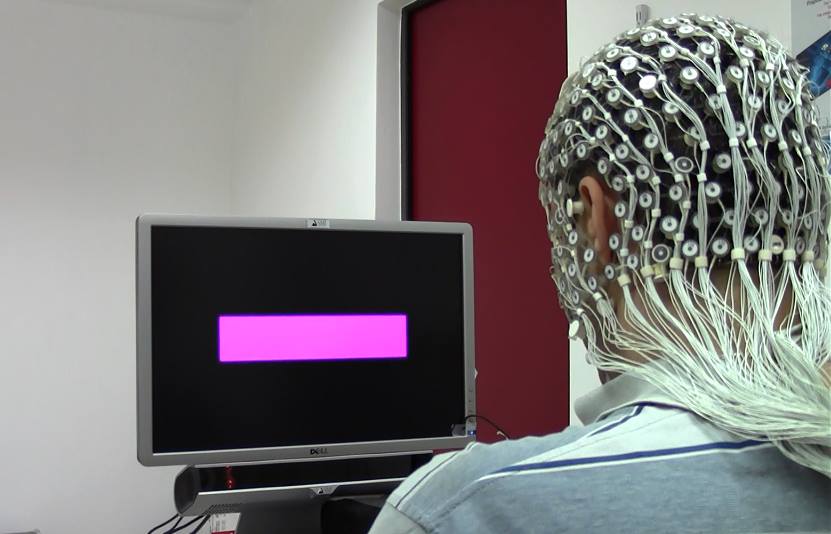
The stimulus of the experiment was a violet box, presented on the center of the monitor, flickering in 5 different frequencies (6.66, 7.50, 8.57, 10.00 and 12.00 Hz). The box flickering in a specific frequency was presented for 5 seconds, followed by 5 seconds without visual stimulation before the box appears again flickering in another frequency. The background color was black for the whole experiment.
Resources:
EEG SSVEP Dataset I along with the accompanying report.
ssvep-eeg-processing-toolbox that can be used to process this dataset and support experimentation.
Comparative evaluation of state-of-the-art algorithms for SSVEP-based BCIs technical report summarizing our experimental findings.
Video demonstrating one trial.